BI 231 Physiology Lab exercises
MEASURING EKG
You already know one way of measuring heart rate with the MacLab, using the finger pulse transducer. Today you’ll try a second way, using the EKG. The EKG measures heart rate based on the electrical impulses passing across the heart.
Because the EKG is just a measurement of electricity in a muscle, we’ll use the EMG setup file again, and the same electrode setup we used for measuring EMGs. The only difference will be that instead of putting the red and black electrodes on the belly of a muscle, we’ll put them on each side of the heart – one on the right wrist and one on the left ankle. The ground electrode will go on the right ankle.
Adjust the trace just as you adjusted the EMG trace, but instead of making your subject do things have her sit completely still, or even lie down. You only want to see the heart’s activity.
An EKG trace has three peaks:
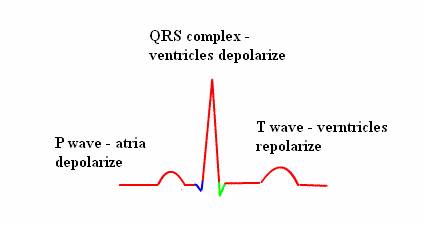
To calculate the heart rate, you usually count the number of QRS complexes as they are the bigger and easier to see. But you could also calculate the atrial rate by counting the P waves.
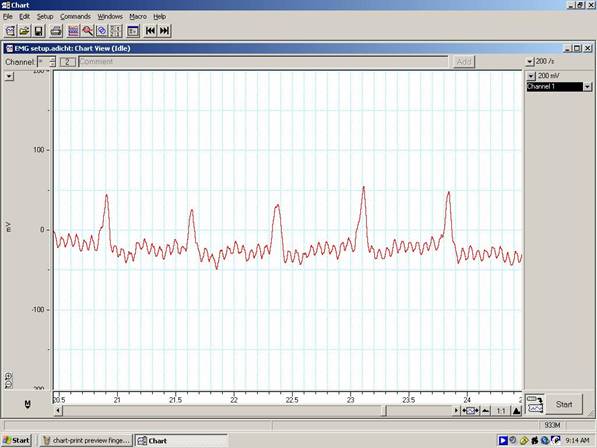
In the trace below, what is the subject’s ventricular rate in beats/minute? What is the atrial rate?
The Diving reflex
When an animal dives underwater for a sustained period of time, it commonly changes its physiology. Because the lungs are not receiving any fresh air, the blood is not carrying much Oxygen. Therefore, the animal shifts to anaerobic respiration and reduces its blood flow to the muscles. This means it can save energy by reducing heart rate.
A harbor seal at the surface of the water has a heart rate of 120-140 bpm. When it dives, however, its heart rate may decrease to fewer than 20 bpm (Schmidt-Nielsen, 1997).
Humans also have this reflex, and it has been used clinically to reduce the heart rates of clients in the emergency room (Aydin et al., 1995). The reflex is usually elicited by having the client submerge his or her face in a basin of ice water. In babies, it is sometimes elicited by putting a latex glove filled with ice water on the child’s face.
Your task in this lab is to evaluate whether placing a washcloth soaked in ice water on a
subject’s face will elicit the diving reflex strongly enough to significantly
reduce her heart rate.
1. Design a class experiment - you will have to explain your method in enough detail so that everybody does the same thing and results are comparable
2. Design a class
data sheet, and create it on Excel so everyone can enter their data
3. Use the MacLab to
gather data on heart rate with and without a cold washcloth
4. When you analyze
the data:
Calculate the average heart rates
before and after ice-water washcloth
Do this by adding all the scores and dividing by the number of scores.
To calculate the
averages from your Excel spreadsheet, do this:
1. Find the column with the data you want to average.
2. Click on the empty cell below the last number in the column
3. Hit the = sign in the bar at the top of the spreadsheet
4. Hit the down arrow to the left of the = sign. Now some options will appear.
5. Click on “AVERAGE”
6. If it is not on the list, click “more functions,” choose “statistical,” then “AVERAGE”
7. A dialog box will appear, asking you what cells you want the average taken over. Doublecheck to make sure they are the cells you want averaged, then click OK.
8. The average will appear! You may forget what it is if you don’t label it, so click on the box just before it and type ‘average’ to remind yourself.
When you report an average, you should also report the number of people you took the average over. It is abbreviated ‘n’. You would write: “The average heart rate with a cold washcloth on the face was 96 bpm (n=17).” In your data table, you would also give the n value, either as part of the caption or as a footnote.
Graph the average heart rates
1. This chart will only contain two values. To select them, click on one value and then hold the ‘Ctrl’ key down and click on the second value.
2. When you’ve selected both cells, click on the chart icon on the toolbar.
3. Make a column chart and label its axes. Save it on a new sheet.
4. You’ll see a big problem with this chart – it doesn’t start at zero on the bottom of the Y axis. Charts that do this are regarded as dishonest, so you want to fix it right away. To do this, doubleclick on the first value on the y axis.
5. A dialog box will appear, asking you how you want to change that axis. Choose ‘scale.’
6. Set the minimum at 0 and click OK.
SMALL GROUP ASSIGNMENT: Using a wet washcloth is problematic for many situations. You’ve been asked to come up with a less messy way of causing the diving reflex. Design and test your method and turn in a report on your results, including:
-- Introduction
-- Methods and materials section
-- Results, including data
traces that show how you calculated heart rates.
Literature Cited
Aydin, M. et al., 1995. Application of ice water to the face in initial treatment of supraventricular tachycardia. Turk J Pediatr. 37(1):15-17
Schmidt-Nielsen, K., 1997. Animal Physiology, 5th
Edition.